
Learning Center
How to build an efficient portfolio?
Building an efficient frontier using SAFE TOOLBOXESTM is a very straightforward process. First, you have to choose what type of analysis you want. SAFE TOOLBOXESTM comes with three options:
- Standard Markowitz Mean-Variance portfolio analysis
- Mean-CVaR portfolio analysis
- Black and Litterman portfolio analysis
For a given target return, the first approach gives a combination of assets that provides the portfolio with the minimum variance. The second approach is very similar to the first one, except that the risk measurement to be minimized is the Conditional Value at Risk – CVaR – instead of the Variance. The Black and Litterman framework also uses a Mean-Variance optimization technique, but it adjusts the historical estimated mean and variance matrices adding an element that reflects your personal view for the future prices of assets.
To give an example of estimating an efficient portfolio, let’s compute one using the Markowitz framework. The other approaches follow very similar steps.
Suppose you have the following database with the historical prices of assets:
Hint: You could use the historical prices quotes tool to get the database
A |
B |
C |
D |
E |
F |
|
1 |
|
Apple Inc. |
Microsoft Corporation |
Exxon Mobil Corporation |
Wells Fargo & Company |
Johnson & Johnson |
2 |
Jan-10 |
25.4 |
24.1 |
54.2 |
24.7 |
51.8 |
3 |
Feb-10 |
27.1 |
24.6 |
55.0 |
23.8 |
52.3 |
4 |
Mar-10 |
31.1 |
25.1 |
56.7 |
27.1 |
54.2 |
5 |
Apr-10 |
34.5 |
26.2 |
57.4 |
28.8 |
53.4 |
6 |
May-10 |
34.0 |
22.2 |
51.5 |
25.0 |
48.9 |
7 |
Jun-10 |
33.3 |
19.8 |
48.7 |
22.3 |
49.5 |
8 |
Jul-10 |
34.0 |
22.2 |
50.9 |
24.2 |
48.7 |
9 |
Aug-10 |
32.2 |
20.3 |
50.8 |
20.6 |
48.2 |
10 |
Sep-10 |
37.5 |
21.2 |
53.1 |
21.9 |
52.4 |
11 |
Oct-10 |
39.8 |
23.1 |
57.1 |
22.7 |
53.9 |
12 |
Nov-10 |
41.2 |
22.0 |
60.1 |
23.8 |
52.5 |
13 |
Dec-10 |
42.7 |
24.3 |
63.2 |
27.1 |
52.8 |
14 |
Jan-11 |
44.9 |
24.2 |
69.7 |
28.3 |
51.0 |
... |
... |
... |
... |
... |
... |
... |
60 |
Nov-14 |
116.3 |
46.5 |
86.7 |
52.6 |
105.1 |
61 |
Dec-14 |
107.9 |
45.2 |
88.6 |
53.0 |
101.6 |
62 |
Jan-15 |
114.6 |
39.3 |
83.8 |
50.2 |
97.3 |
63 |
Feb-15 |
126.1 |
43.0 |
85.5 |
53.3 |
100.3 |
64 |
Mar-15 |
122.2 |
39.9 |
82.1 |
52.9 |
98.4 |
65 |
Apr-15 |
122.9 |
47.7 |
84.3 |
53.6 |
97.0 |
66 |
May-15 |
128.4 |
46.2 |
82.9 |
54.8 |
98.7 |
67 |
Jun-15 |
123.7 |
43.6 |
81.0 |
55.1 |
96.0 |
68 |
Jul-15 |
119.6 |
46.1 |
77.1 |
56.7 |
98.7 |
69 |
Aug-15 |
111.7 |
43.2 |
73.9 |
52.6 |
93.3 |
70 |
Sep-15 |
109.2 |
44.0 |
73.0 |
50.6 |
92.7 |
71 |
Oct-15 |
118.3 |
52.3 |
81.3 |
53.4 |
100.3 |
72 |
Nov-15 |
117.7 |
54.3 |
80.9 |
54.7 |
101.2 |
73 |
Dec-15 |
104.7 |
55.5 |
77.2 |
53.9 |
102.7 |
… |
|
|
|
|
|
|
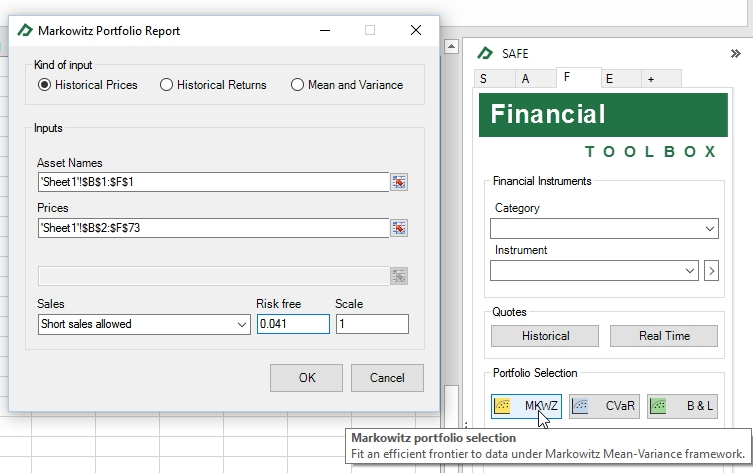
The next step is to go to the Financial Toolbox and click on the “Markowitz” button. Now select the following configuration and click OK.
The results will be presented in a new Excel tab as shown below:
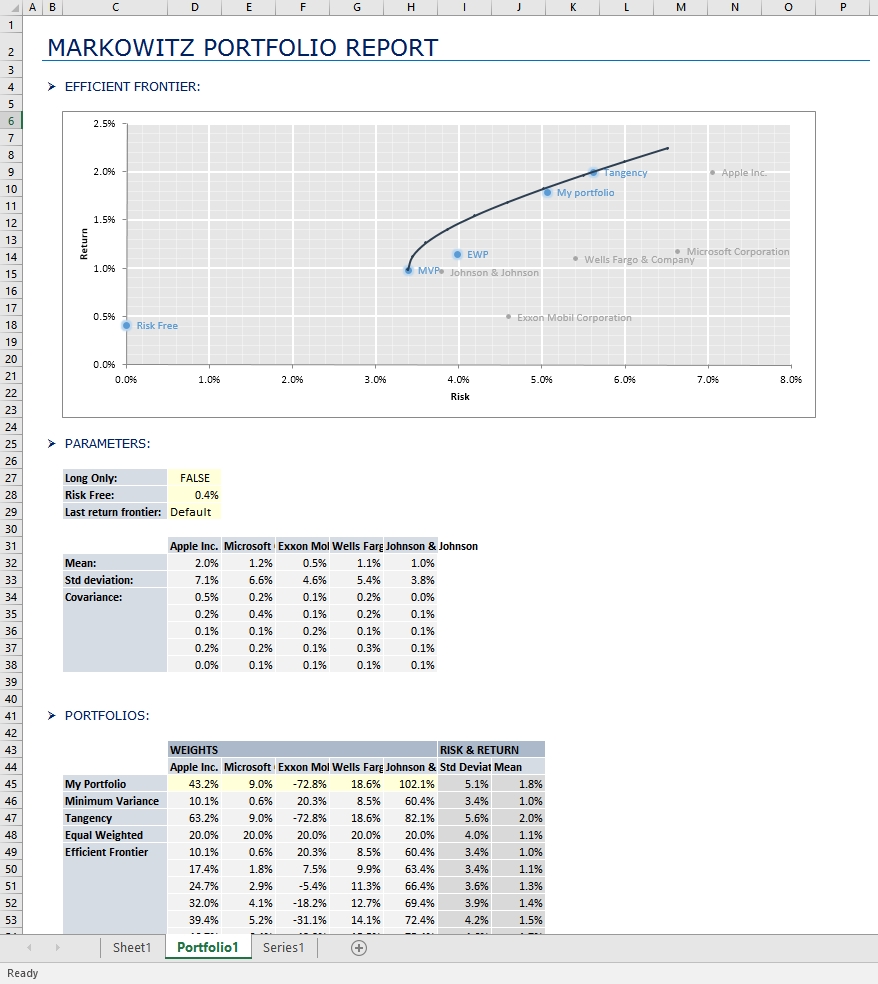
As you can see, the results include an efficient frontier plot that highlights the equally weighted portfolio, the tangency portfolio and the minimum variance portfolio. It also shows one sample portfolio with the desired return that you want. All chart series data is available in a table that can be modified in order to reflect new inputted parameters.