Learning Center
How to perform an automatic sensitivity analysis?
Sensitivity analysis is a method to understand how changes in function inputs affect the value of its outcome. Using SAFE TOOLBOXES®, with just one click, you can find out how changes in cell precedents would affect its value.
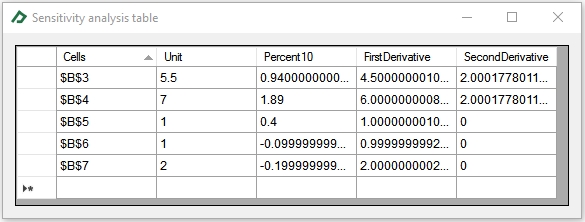
SAFE TOOLBOXES® measures the impact in three different ways: the impact of a unitary change in inputs, the impact of a 10% change in inputs and the impact of a very tiny change in inputs (i.e., shows a numerical approximation of the derivative function). If you are interested in just one input, you can also use the level curve plot tool to check what would be the function values when the input values are within a specified range.
To give an example of this tool, let’s perform the sensitivity analysis of the cell B9 below:
A |
B |
C |
D |
E |
|
1 |
Sensitivity analysis example |
|
|
|
|
2 |
|
|
|
|
|
3 |
x |
2 |
=2 |
|
|
4 |
y |
3 |
=3 |
|
|
5 |
g(x)=x^2 |
4 |
=B3^2 |
|
|
6 |
h(k)=2*k+1 |
-1 |
=2*B7+1 |
|
|
7 |
k |
-1 |
=-1 |
|
|
8 |
|
|
|
|
|
9 |
f(x,y,z)=x/2+y^2+g(x)+h(k) |
13 |
=B3/2+B4^2+B5+B6 |
|
|
10 |
|
|
|
|
|
As you can note, the cell B9 have four immediate precedents: cells B3, B4, B5 and B6 and one indirect precedent, the cell B7. The cell B3 affects the cell B9 directly and indirectly since it also influences cell B4 that affects cell B9. This chain of events is appropriately considered in the sensitivity analysis since the impacts are collected effectively changing the input cell value in the background.
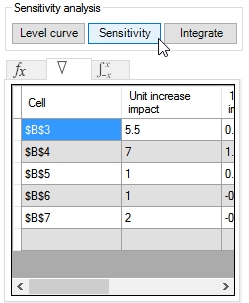
To run a sensitivity analysis on cell B9, follow these steps:
- Select the General Toolbox tab;
- Select the B9 cell
- Click on button “Sensitivity”
To see the “Sensitivity Analysis” report select the ![]() tab. You can double click it to view the table in an enlarged form.
tab. You can double click it to view the table in an enlarged form.