
Learning Center
How to use actuarial functions?
The ACTUARIAL TOOLBOX comes with the most standard actuarial functions used for life-contingent products. The full list of actuarial functions is presented below:
| # | Function Name | Function Description |
|---|---|---|
1 |
sActuarialTablesList |
Returns all actuarial tables in the database. |
2 |
sActuarialTableValues |
Returns the values of the selected table. |
3 |
sActuarialTableName |
Returns the name of the table for the specified table number. |
4 |
sActuarialqxVector |
Returns the mortality rates, morbidity rates or scale of selected table. |
5 |
sActuarialqxValue |
Returns the mortality rate, morbidity rate or scale in selected table at a given age. |
6 |
sActuarialpxValue |
Returns the survivorship probability in selected table at a given age. |
7 |
sActuarialpxVector |
Returns the survivorship probability of selected table. |
8 |
sActuarialnpxValue |
Returns the probability that a life age x will survive n years. |
9 |
sActuarialnpxVector |
Returns a vector with the probabilities of an individual aged x to be alive at ages 0-130. |
10 |
sActuarialqxnpxVector |
Returns a vector with the probabilities of an individual aged x dying on the exact age of 0-130. |
11 |
sActuarialexValue |
Returns the remaining life expectancy of a person aged x. |
12 |
sActuarialOmegaValue |
Returns the age that can not be achieved by any person of the initial population. |
13 |
sActuariallxVector |
Returns a vector with the number of living people at ages 0-130. |
14 |
sActuariallxValue |
Returns the number of persons who attain age x. |
15 |
sActuarialdxVector |
Returns a vector with the number of people who die at ages 0-130. |
16 |
sActuarialdxValue |
Returns the number of persons who die between ages x and x+1. |
17 |
sActuarialTable |
Returns the complete life table for selected table. |
18 |
sActuarialRANDqxVector |
Returns a random vector representing ages 0-130 of an individual aged x with the states 0 for living or healthy and 1 for dead or disabled. |
19 |
sActuarialRANDqxValue |
Returns a random age of death or disability of an individual aged x. |
20 |
sActuarialRANDqxVectorPopulation |
Returns a random vector with the number of people who died or became disabled at ages 0-130. |
21 |
sActuarialRAND3qxVector |
Returns the respective random states at ages 0-130 of an individual aged x: 1 = is disabled, 1 = dead of a healthy person, 1 = dead of a disabled person. |
22 |
sActuarialRAND3qxValue |
Returns a random vector with ages in which the events of becoming disabled, death of a healthy person and death of a disabled person occurred. |
23 |
sActuarialRAND3qxVectorPopulation |
Returns a random vector with the numbers: alive and healthy people, alive and disabled people, deaths of healthy persons and deaths of disabled persons. |
24 |
sActuarialGenerationalTableqxMatrix |
Returns a collection of mortality rates projected by year. |
25 |
sActuarialGenerational2dTableqxMatrix |
Returns a collection of mortality rates projected by year. |
26 |
sActuarialGenerationalTableqxVector |
Returns the appropriate mortality rates vector for an individual aged x using a generational mortality table. |
27 |
sActuarialGenerational2dTableqxVector |
Returns the appropriate mortality rates vector for an individual aged x using a generational mortality table. |
28 |
sActuarialnpxnpixVector |
Returns a matrix with the probabilities of an individual aged x to be alive and healthy (column 1) and the probabilities of him to be alive and disabled (column 2) at ages 0-130. |
29 |
sActuarialTableMultipleDecreases |
Returns multiple decrement life table. |
30 |
sActuarialFlatRateVector |
Returns a vector of size 131 with the specified yield rate. |
31 |
sActuarialnpxnpixVectorMultipleDecreases |
Returns a matrix with the probabilities of an individual aged x to be alive and healthy (column 1) and the probabilities of him to be alive and disabled (column 2) at ages 0-130. |
32 |
sActuarialnqxnqixVector |
Returns the cumulative probability of an individual aged x dying by any decrement (death of a healthy person or death of a disabled person) at ages 0-130. |
33 |
sActuarialnpxForecastVector |
Returns a vector with the probabilities of an individual aged x to be alive at years 0-130. |
34 |
sActuarialqxnpxForecastVector |
Returns a vector with the probabilities of an individual aged x dying on the exact years of 0-130. |
35 |
sActuarialnpxnpixForecastVector |
Returns a matrix with the probabilities of an individual aged x to be alive and healthy (column 1) and the probabilities of him to be alive and disabled (column 2) at years 0-130. |
36 |
sActuarialnpxnpixMultipleDecreasesForecastVector |
Returns a matrix with the probabilities of an individual aged x to be alive and healthy (column 1) and the probabilities of him to be alive and disabled (column 2) at years 0-130. |
37 |
sActuarialdummyForecastVector |
Returns a vector to indicate in the years 0-130 the occurrence of a permanent event at age 'xevent' of an individual with age 'xnow'. |
38 |
sActuarialdummyVector |
Returns a vector to indicate in the ages 0-130 the occurrence of a permanent event at age 'xevent' of an individual with age 'xnow'. |
39 |
sx |
Returns a vector with the ages 0-130. |
40 |
sActuarialxForecastVector |
Returns a vector with the projected ages of an individual aged x in the years 0-130. |
41 |
sActuarialvalueForecastVector |
Returns a vector for the years 0-130 with the specified value at age 'xevent' of an individual with age 'xnow'. |
42 |
sActuarialAccruedInterestForecastVector |
Returns the accumulated yield factor for the years 0-130. |
43 |
sActuarialAnnuityCertainPresentValue |
Returns the present value of an annuity-certain per annum for n years. |
44 |
sActuarialAnnuityCertainFutureValue |
Returns the accumulated amount of an annuity-certain per annum for n years. |
45 |
sActuarialAnnuityLiability |
Returns the present value of an annuity to continue during the person's life, but not after the year n. |
46 |
sActuarialAnnuityCashFlows |
Returns the cash flows of an annuity to continue during the person's life, but not after the year n. First column = raw cash flow, second column = actuarially projected cash flows, third column = financially and actuarially discounted cash flows. |
47 |
sActuarialAssuranceLiability |
Returns the present value of an assurance valid for n years and payable at the end of the year of the person's death. |
48 |
sActuarialAssuranceCashFlows |
Returns the cash flows of an assurance valid for n years and payable at the end of the year of the person's death. First column = raw cash flows, second column = actuarially projected cash flows, third column = financially and actuarially discounted cash flows. |
49 |
sActuarialSalaryPurchasingPowerFactor |
Returns a factor to adjust the effect of monthly inflation on real annual income. |
50 |
sActuarialSocialSecurityConstantGrowthForecastVector |
Returns the Social Security benefit projection for years 0-130. |
51 |
sActuarialSocialSecurityVectorGrowthForecastVector |
Returns the Social Security benefit projection for years 0-130. |
52 |
sActuarialSalaryGrossForecastVector |
Returns the salary projection for years 0-130. |
53 |
sActuarialSalaryNetForecastVector |
Returns the portion of the salary that exceeds the Social Security benefit. |
54 |
sActuarialContributionsForecastVector |
Returns the projected contributions of employees (column 1) and retirees (column 2) for years 0-130. |
55 |
sActuarialnpxDependentForecastVector |
Returns a vector with the probabilities that at least one valid dependent will survive at the end of years 0-130. |
56 |
sActuarialSpotInterestRatesToDiscountFactorForecastVector |
Converts a vector of spot interest rates to a vector of discount factors. |
57 |
sActuarialForwardInterestRatesToSpotInterestRatesForecastVector |
Converts a vector of forward interest rates to a vector of spot interest rates. |
58 |
sActuarialSpotInterestRatesToForwardInterestRatesForecastVector |
Converts a vector of spot interest rates to a vector of forward interest rates. |
59 |
sActuarialForwardInterestRatesToDiscountFactorForecastVector |
Converts a vector of forward interest rates to a vector of discount factors. |
60 |
sActuarialEndSalaryAssuranceCashFlows |
Returns the cash flows of an end salary assurance payable at the end of the year of the person's death. First column = actuarially projected cash flows, second column = financially and actuarially discounted cash flows. |
61 |
sActuarialCashFlows |
Returns a complete report of the cash flows of a complex pension scheme. Insert function via ACTUARIAL TOOLBOX tab to recover headers. |
62 |
sActuarialCashFlowsMultipleDecreases |
Returns a complete report of the cash flows of a complex pension scheme. Insert function via ACTUARIAL TOOLBOX tab to recover headers. |
63 |
sActuarialRANDqxDependentForecastVector |
Returns a random binary matrix indicating pension situation. First column, 1 = Employee alive and healthy; second column, 1 = Retired alive and healthy; third column = Retired disabled; forth column = person is dead with living dependents. |
64 |
sActuarialRANDCashFlows |
Returns a complete report of the random cash flows of a complex pension scheme. Insert function via ACTUARIAL TOOLBOX tab to recover headers. |
65 |
sActuarialBenefitsLiability |
Returns the present value of a complex pension scheme. |
66 |
sActuarialBenefitsLiabilityMultipleDecreases |
Returns the present value of a complex pension scheme. |
67 |
sActuarialEndSalaryAssuranceLiability |
Returns the present value of an end salary assurance payable at the end of the year of the person's death. |
68 |
sActuarialRANDBenefitsLiability |
Returns a random present value of a complex pension scheme. |
69 |
sActuarialCashFlowsVector |
Extracts the actuarial projection of cash flows calculated using the function "sActuarialCashFlows", "sActuarialCashFlowsMultipleDecreases" or "sActuarialRANDCashFlows". |
70 |
sActuarialBenefitsLiabilitiesVector |
Extracts the actuarial projection financially discounted of cash flows calculated using the function "sActuarialCashFlows", "sActuarialCashFlowsMultipleDecreases" or "sActuarialRANDCashFlows". |
The usage of actuarial tables in actuarial functions is highly flexible and it can be done by one of the following methods (see examples below):
- Using the number of a table registered in the database (this is the default option);
- Using the name of a table registered in the database;
- Using the table values inserted in an Excel range; and
- Entering the qx vector directly as a function argument.
A |
B |
C |
D |
|
1 |
Life expectancy at age 60 (table UP 1994 female) |
|
|
|
2 |
Using table number |
24.96938061 |
=sActuarialexValue(6,60) |
|
3 |
Using table name |
24.96938061 |
=sActuarialexValue("UP1994F",60) |
|
4 |
Using table range |
24.96938061 |
=sActuarialexValue(B10:B140,60) |
|
5 |
Entering the qx vector |
24.96938061 |
=sActuarialexValue(sActuarialqxVector("UP1994F"),60) |
|
6 |
|
|
||
7 |
|
|
|
|
8 |
Table UP 1994 female |
|
|
|
9 |
Age |
Mortality rates (qx) |
|
|
10 |
0 |
0.00000 |
=sActuarialqxVector("UP1994F") |
Note: after entering this formula click on the "Multiple Values Formula" button. |
11 |
1 |
0.00057 |
|
|
… |
… |
… |
|
|
139 |
129 |
1.00000 |
|
|
140 |
130 |
1.00000 |
|
|
Besides the option of calling the function directly in Excel, there is also the option to insert a template of usage of the function choosing one of the options in the tools group.
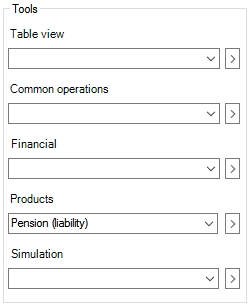
For instance, if you want to calculate the actuarial liability of an individual in a pension fund the following result can be immediately achieved by clicking on the “Products/Pension (liability)” option:
|
A |
B |
C |
1 |
Actuarial liability (Defined Benefit) |
|
|
2 |
|
|
|
3 |
Retired contribution |
0.05 |
|
4 |
Worker contribution rate over gross salary |
0 |
|
5 |
Worker contribution rate over net salary (gross - social security) |
0.1 |
|
6 |
Administrative costs |
0.1 |
|
7 |
Current gross salary (annual) |
100000 |
|
8 |
Current age |
30 |
|
9 |
Retirement age |
65 |
|
10 |
Growth (real) rate of worker salary |
0.03 |
|
11 |
Growth (real) rate of retired pension |
0 |
|
12 |
Disability entrance table |
80 |
|
13 |
Life table normal life |
6 |
|
14 |
Life table disabled life |
3 |
|
15 |
Current Social Security reference benefit (annual) |
30000 |
|
16 |
Growth (real) rate of Social Security reference benefit |
0.01 |
|
17 |
Is normal |
TRUE |
|
18 |
Forward (real) interest rate curve |
0.05 |
|
19 |
Life table dependent |
1 |
|
20 |
Expected inflation rate |
0.05 |
|
21 |
Life insurance benefit (% over salary) |
0.083333333 |
|
22 |
Age at wedding |
27 |
|
23 |
Children maximum age to receive benefits |
20 |
|
24 |
Partner age |
28 |
|
25 |
First child age |
1 |
|
26 |
Second child age |
-2 |
|
27 |
Third child age |
131 |
|
28 |
Fourth child age |
131 |
|
29 |
Fifth child age |
131 |
|
30 |
Extra worker contribution |
0 |
|
31 |
Limiting age to become disabled |
130 |
|
32 |
Retirement salary conversion rate |
1 |
|
33 |
Dependent benefit conversion rate |
1 |
|
34 |
Actuarial liability |
$ 613,131.82 |
=-sActuarialBenefitsLiability($B$3,$B$4,$B$5,$B$6,$B$7,$B$8,$B$9,sActuarialFlatRateVector($B$10), sActuarialFlatRateVector($B$11),sMxElemMult(sActuarialqxVector($B$12),sActuarialdummyVector($B$31,1)), $B$13,$B$14,$B$15,sActuarialFlatRateVector($B$16),$B$17,sActuarialFlatRateVector($B$18),$B$19,$B$20, $B$21,$B$22,$B$23,$B$24,$B$25,$B$26,$B$27,$B$28,$B$29,$B$30,$B$32,$B$33) |
35 |
|
|
|